New COVID-19 Policy Mapping Tool and Database Released to Help Inform Decision-making
Media Contact
Karen Teber
km463@georgetown.edu
WASHINGTON (July 16, 2020) — Amid a resurgence in COVID-19 cases and in anticipation of outbreaks intensifying over the summer, the experts behind COVID-Local.org have launched a new policy mapping tool and comprehensive database. The tool allows community and national leaders to measure their phased reopening and ongoing local disease spread against the impact of specific policies — like social distancing, wearing masks or limiting crowd size — on suppressing COVID-19 across the United States and around the world.
The new tool, COVID Analysis and Mapping of Policies, supports effective COVID-19 decision-making and policy implementation, in combination with other COVID-Local tools, such as the phased metrics for safe reopening and the Frontline Guide for Local Decision Makers (available in U.S. and international versions).
“Throughout this global health crisis, local leaders have had to make tough decisions to protect public safety,” Tim Burton, executive director of the Montana League of Cities and Towns, said. “The data provided in COVID-Local’s new policy mapping tool clearly shows the impact of these decisions, which can help leaders assess future policymaking.”
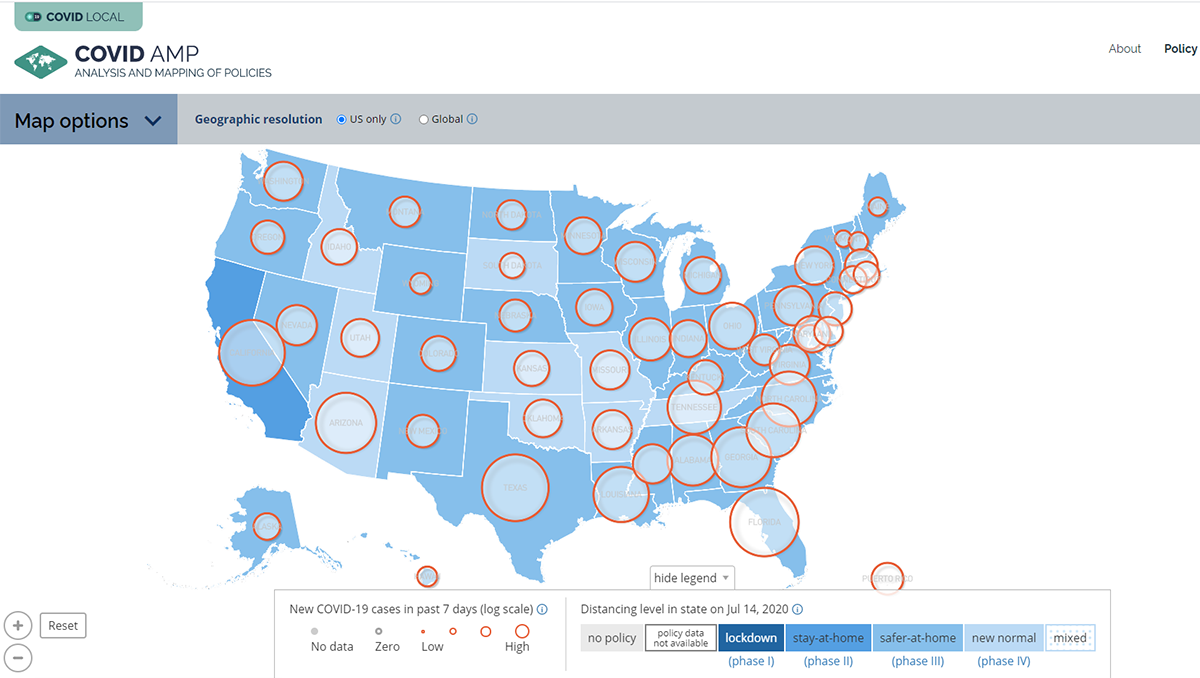
Local leaders can explore what policies other counties, states and countries are implementing and how those policies relate to success at suppressing COVID-19. They can get answers to questions such as: What is the current status of social distancing in my locale? Have our local policies been effective in reducing COVID-19 cases? What are other states and countries doing that is working to suppress the virus?
Site visitors can compare the impact of policies such as stay-at-home or phased reopening that have been implemented at various phases of the outbreak in different geographic areas at county, state or national levels, and around the world. The tool provides an illustrative map and charts depicting how specific policies have affected the number of cases over time.
Comprehensive data on policies for the tool is collected and coded by a research team at Georgetown University’s Center for Global Health Science and Security and Talus Analytics, which includes experts in epidemiology, microbiology, virology, animal and human health systems, demography, economics, finance, statistics and law.
COVID Analysis and Mapping of Policies is part of the COVID-Local suite of free resources developed for local decision makers, including mayors, tribal leaders, and public health officials in the United States and across the globe, who are working to keep their communities safe during the COVID-19 pandemic. COVID-Local’s phased reopening metrics are in alignment with new framework guidance developed by a collaborative network of leading research, policy, and public health experts. This initiative, which COVID-Local experts joined, was led by Harvard’s Global Health Institute and the Edmond J. Safra Center for Ethics to provide decision makers with clear and unified reopening guidance.
“COVID-Local’s step-by-step framework and metrics for phased re-opening help local leaders make effective, strategic, and informed decisions to slow the spread of COVID-19 and track the virus as we enter a new normal,” said Seattle Mayor Jenny Durkan.
COVID-Local is a joint project of four organizations: the Global Biological Policy and Programs team at the Nuclear Threat Initiative (NTI), the Center for Global Development, and the Georgetown University Center for Global Health Science and Security, and Talus Analytics. This team is comprised of former public health officials and experts with decades of experience in disease outbreaks.
The guidance available on COVID-Local.org was also developed with contributions from experts across the fields of medicine, academia, emergency response, and private industry. This team is bringing their own real-life experiences in disease outbreaks and epidemic response to support local officials. For more information, visit www.covid-local.org/amp.
The data available on COVID Analysis and Mapping of Policies (COVID AMP) is compiled from publicly available open source information on government-issued policies, and plans or guidance issued by governments, nonprofits, for-profit, and higher education institutions.